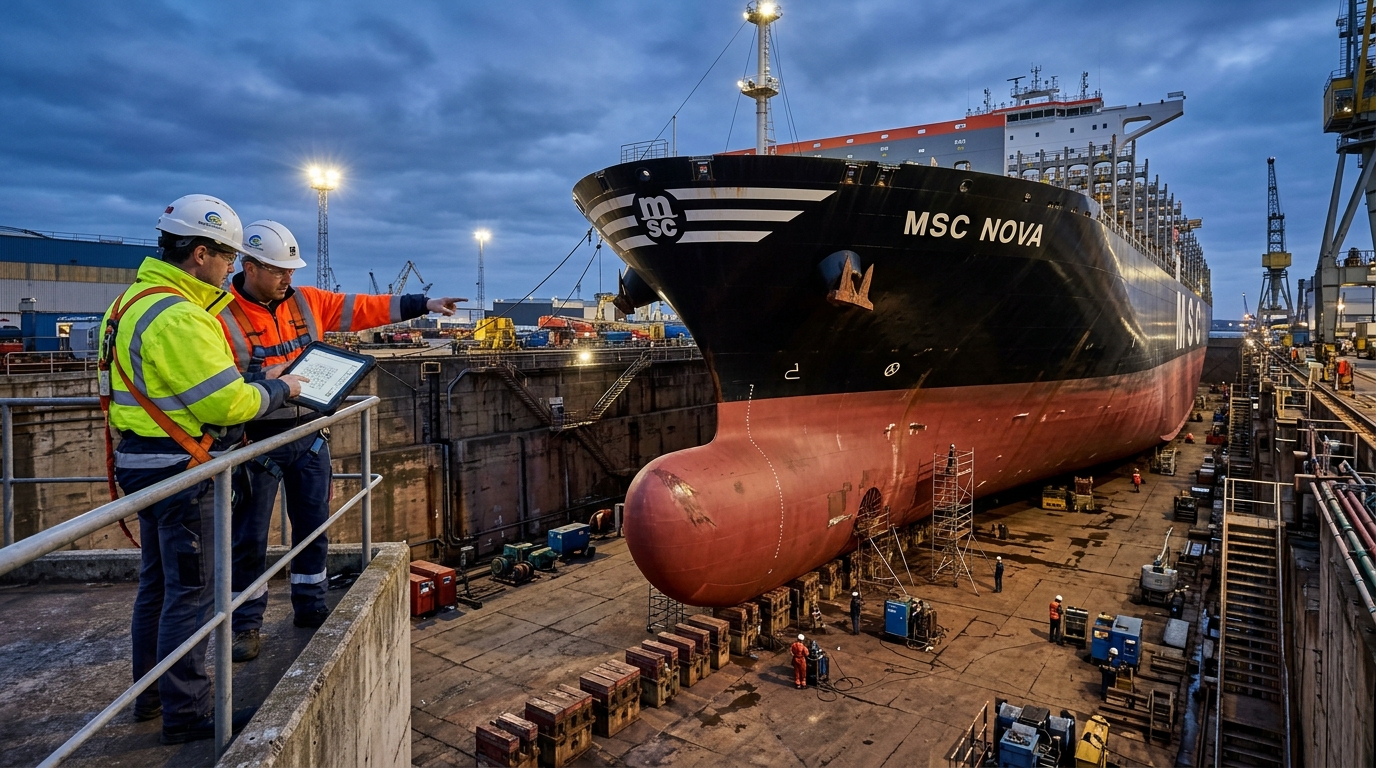
Drydocking Forecast Q4 2026: 4,861 Vessels Due Between October and December

Every week TrustedDocks projects the next drydocking for 28,400 vessels from their survey cycle, trading pattern and current position. This is the fourth-quarter 2026 picture: how many ships are due, where they will be when the date arrives, and what that means for yard capacity between October and December.
4,861 vessels are forecast to dock between October and December
Of the 28,424 vessels with a computed forecast, 4,861 have a projected docking date inside the fourth quarter, an average of about 1,600 a month. That is a seasonal high: the survey calendar clusters at year end because owners prefer to close a class cycle before the anniversary, and because the Atlantic and northern-European yards see their last good weather window before winter.
By size, the demand splits into two very different markets:
| Vessel length | Forecast dockings, Q4 2026 | Where it goes |
|---|---|---|
| Under 100 m | 1,915 | Tugs, offshore support, ferries, fishing vessels: slipways and small floating docks, mostly regional |
| 100 to 199 m | 1,823 | Handysize and Supramax bulkers, product tankers, feeders: the bread and butter of the repair yards |
| 200 to 299 m | 871 | Panamax to Post-Panamax: needs a 300 m graving or floating dock |
| 300 m and over | 252 | Capesize, VLCC, large container: fewer than 250 docks worldwide can take them |
The last line is the capacity story. Two hundred and fifty-two ships over 300 metres are due in a single quarter, and the world has roughly 250 graving and dry docks of that length, many of them fully booked with newbuilding or naval work. Owners of large tonnage who have not fixed a Q4 slot are already late.
By vessel type
| Type | Forecast dockings, Q4 2026 |
|---|---|
| Bulk carriers | 856 |
| Tankers | 741 |
| Tugs | 463 |
| Container ships | 378 |
| Passenger, ferry and ro-ro | 339 |
| Offshore support vessels | 277 |
| Gas carriers | 178 |
| Fishing vessels | 153 |
| Not yet classified | 1,435 |
Bulkers and tankers together are a third of the classified demand, which matches the age profile of those fleets: the large ordering waves of 2009 to 2012 are now at their third special survey. The unclassified line is mostly small craft whose type field has not yet been resolved in the source registries; it is included in the totals above and excluded from the type table.
Where the ships will be: the sailing-area view
The forecast assigns each vessel to the sailing area where it is most likely to be when its docking falls due, based on its trading pattern over the last year. That is the number a yard should care about: not where the owner sits, but where the hull will be.
| Sailing area | Vessels due in Q4 2026 |
|---|---|
| South-East Asia (China, Vietnam) | 2,029 |
| South Asia | 1,867 |
| East Mediterranean & Black Sea | 1,696 |
| North Sea / Atlantic | 1,560 |
| Red Sea & Persian Gulf | 1,318 |
| Indian Ocean | 1,170 |
| North Asia (Japan, Korea) | 1,023 |
| Baltic Sea | 1,015 |
| West Mediterranean | 941 |
| West Africa | 921 |
| South Africa | 884 |
| South America East Coast | 724 |
A vessel that trades between two areas is counted in both, so the column adds to more than 4,861; read it as exposure, not a partition.
Set this against the busiest-regions reading of the Ship Repair Index and a mismatch appears. The Red Sea and Gulf area has 1,318 ships due and the quietest yards in the index; the East Mediterranean has 1,696 due and the busiest. Some of that Gulf demand will dock in the Mediterranean or in South Asia instead, as it has all year, but the yards in Fujairah, Dubai and Bahrain are looking at their best quarter of the year on paper.
How reliable is a forecast docking date?
Each projection carries a confidence figure built from four parts: how well the vessel's survey cycle is known, how much of its recent time it spends in the assigned area, how tightly its type keeps to the standard 30- and 60-month intervals, and where it is right now. The average confidence for October dockings is around 10 out of 100 and rises for the later months, which is the honest way to say that the month is a distribution, not an appointment. Used as a yard's pipeline the forecast is very good at answering "how many Supramax bulkers will be within reach of my dock this quarter"; used as a diary it is not. The per-vessel forecasts with their confidence scores and current positions are in the docking forecast tool.
Using it
- Yards: filter the forecast by your sailing area and dock length to see the ships you can physically take, then match against your own booking sheet. The gap is your Q4 sales list.
- Owners and managers: if your ship is over 300 metres or trading in South-East Asia, the two most contested slots this quarter, fix now. Elsewhere, the Gulf is the region where a late booking is still likely to find a dock.
- Suppliers: the sailing-area table is also a map of where survey-driven demand for coatings, cathodic protection, ballast systems and class-related equipment will land between October and December.
Method
- Source: TrustedDocks docking forecast, updated 2 September 2026; 28,424 vessels with at least one projected docking.
- Q4 count: distinct vessels whose projected docking date falls between 1 October and 31 December 2026.
- Sailing-area exposure: distinct vessels per assigned sailing area for those dates; a vessel can appear in more than one area.
- Length bands: length overall from the vessel register; 300 m-plus dock capacity from the TrustedDocks dock database, which lists every graving, dry and floating dock with its dimensions in the shipyard directory.